








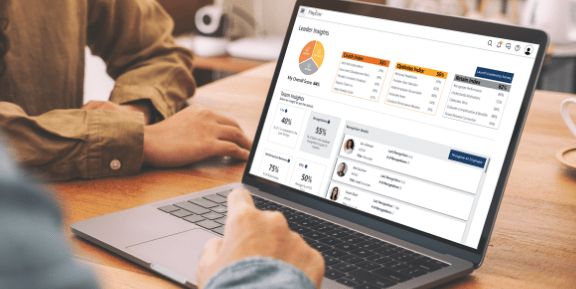

HR sits on more data than almost any other part of the business, but data alone changes nothing. An HR report is what turns headcount, hours, pay, and survey results into decisions a leader can make with confidence. This guide covers the reports every HR team should be generating, from the core set that applies to any company to the specialized and strategic reports that answer harder questions, with the key metrics and a practical example for each.
What Is an HR Report?
An HR report is a structured output of workforce data used to inform decisions, track trends, and measure how people programs are performing. It takes numbers that would otherwise sit in separate systems and organizes them around a question a leader is trying to answer, such as where the company is overstaffed or which teams are losing people fastest.
A report is more than a raw data export. A spreadsheet dump of every employee record is data; a report is the interpretation that data supports. The value lives in the framing: the business question the report answers and the context that makes the numbers mean something. That is also the line between reporting and analytics, which our guide on reporting vs. analytics in HR breaks down in more detail.
Why HR Reporting Matters for Business Leaders
HR reporting is what moves HR from a perceived cost center to a strategic partner. When HR can connect people data to business outcomes, showing how retention affects productivity or how compensation tracks against the market, the conversation with leadership shifts from activity to impact. Data-driven HR teams increasingly earn a seat in planning decisions, a trend documented in industry research like the Sapient Insights report.
Executives and managers lean on HR reports to make the calls that carry real cost. Headcount decisions, compensation adjustments, and workforce planning all depend on current, trustworthy people data, and a good report gives leaders the confidence to act on it. For the numbers that make the business case, our roundup of HR statistics you need to know is a useful companion.
Core HR Reports Every Team Should Run
These are the baseline reports that apply to any organization, whatever its size or industry. They answer the fundamental questions about who works here, who is leaving, who is out, who you’re hiring, and what you’re paying. Get these running reliably first, then layer in the specialized reports that follow.
Headcount Report
A headcount report tracks active employees across the dimensions that matter for planning: department, location, employment type, and role. It’s the simplest report and one of the most used, because nearly every other workforce decision starts with knowing who you have and where they are.
Leaders use headcount data to spot overstaffing in one team and gaps in another, and to check actual staffing against budget in real time. Example: a headcount report showing the support team grew 30% while ticket volume stayed flat flags a cost worth examining before the next budget cycle.
Turnover and Retention Report
This report measures voluntary versus involuntary turnover rates, average tenure, and retention broken out by team or role. Splitting voluntary from involuntary matters, because the two point to very different problems and responses.
A turnover report surfaces the true cost of attrition and flags exactly where retention needs attention now. Example: a report showing 40% annual turnover concentrated in one department points you straight at a manager or pay issue there. Pair it with a set of employee retention metrics to track whether your fixes are working.
Absence and Leave Report
An absence and leave report captures absenteeism rates, leave types, patterns by team or season, and remaining time-off balances. It gives HR a read on how time away from work is distributed and trending.
Absence trends often signal something deeper before problems show up in output. A team with climbing unplanned absences may be heading toward burnout, wrestling with a scheduling problem, or reacting to a culture issue. Example: a spike in unplanned absences on one shift can flag a scheduling or management problem worth addressing before productivity drops.
Recruitment Report
A recruitment report covers the metrics that describe hiring health: open roles, time-to-fill, cost-per-hire, source of hire, and offer acceptance rates. Together they show how well the pipeline is moving and where it stalls.
Hiring managers and HR leaders use this data to find bottlenecks and put recruiting resources where they pay off. Example: a report showing time-to-fill doubled for engineering roles while offer acceptance dropped tells you to look at either the process speed or the competitiveness of the offer. Source-of-hire data then shows which channels deserve more budget.
Compensation Report
A compensation report covers salary ranges, pay equity across demographic groups, total compensation breakdowns, and comparisons against market benchmarks. It connects what you pay to how fairly and competitively you pay it.
This report drives pay equity audits, budget planning, and your position in the market for talent. Example: a compensation report revealing that a role sits 12% below market explains why offers in that role keep getting declined. Because pay and payroll data are closely tied, payroll reports often feed directly into compensation analysis.
Specialized HR Reports for Deeper Workforce Insight
These reports go beyond baseline tracking to answer specific strategic or compliance questions. Not every team needs all of them, and the right mix depends on company size, growth stage, and regulatory environment. You can add them as the questions they answer become relevant to your business.
Employee Performance Report
An employee performance report measures goal completion rates, performance review scores, high-performer identification, and underperformance trends across teams. It gives leaders a structured view of how the workforce is delivering against expectations.
Performance data rarely stays in its own lane. It feeds compensation decisions, informs succession planning, and points to where a learning investment will pay off. Example: a report identifying your top 10% of performers by goal attainment gives succession planning a fact-based starting point instead of a gut call.
HR Compliance Report
A compliance report tracks training completion, certification status, EEO data, FMLA usage, and audit-readiness metrics. It’s the report that keeps regulatory obligations from slipping through the cracks.
Running compliance reports on a regular schedule, rather than only when an auditor asks, lowers regulatory risk and makes responding to an audit or investigation far simpler. Example: a report flagging that 15% of employees have overdue mandatory training lets you close the gap before it becomes a finding.
Employee Engagement Report
An engagement report surfaces survey scores, pulse check trends, eNPS, and participation rates across teams. It measures the emotional commitment behind the output, not just the output itself.
Engagement is a leading indicator worth watching monthly, because it moves ahead of the outcomes leaders care about: teams with low engagement scores tend to show higher turnover and lower productivity. Example: a report showing one team’s engagement score dropped 15 points in a quarter is an early warning to intervene before the resignations start.
HR Audit Report
An HR audit report covers policy compliance, data accuracy, process gaps, and the integrity of your HR systems. It’s a health check on the HR operation itself rather than the workforce.
Run an HR audit at moments of elevated risk or change: ahead of merger and acquisition activity, after a stretch of rapid hiring, or as part of an annual HR review. Example: an audit run before an acquisition that finds inconsistent employee classifications lets you fix them before they surface in due diligence.
Strategic HR Reports for Leadership and the Board
Operational reports answer “what is happening” for the people who run HR day to day. Strategic reports answer “what does it mean for the business” for senior leadership and the board. The difference is altitude: strategic reports emphasize trends, forecasts, and business impact rather than raw counts, and they translate people data into the language executives use.
An HR board report typically includes workforce cost as a percent of revenue, headcount against plan, the company’s key talent risks, and progress on belonging and employee experience goals. It gives the board a concise read on whether the workforce is a source of strength or risk heading into the next period.
Monthly HR Report
A monthly HR report covers what changed since last month: movement in key metrics, a hiring and attrition summary, current compliance status, and any workforce issues that are escalating. Its job is to keep leaders current without drowning them in detail.
A simple, repeatable structure keeps it useful month to month:
- Headline metrics: headcount, turnover, and open roles, each with the change from the prior month.
- Hiring and attrition: new hires, departures, and the reasons behind notable exits.
- Compliance status: training completion and any open items or deadlines.
- Watch list: emerging issues, at-risk teams, and what you’re doing about them.
Annual HR Report
An annual HR report contains the full-year view: workforce trends over the year, year-over-year comparisons, the return on people-program investments, and the goals set for the year ahead. It’s the report that closes the loop on the past year and frames the next.
Done well, the annual report positions HR as accountable to business outcomes rather than activity, which builds credibility with executive stakeholders. Showing that an onboarding investment cut first-year turnover, with the numbers to prove it, is what earns HR the budget and trust to do more.
How to Build an HR Report That Gets Used
A report only earns its keep if someone acts on it, and that starts with the question, not the data. Begin by naming the business question the report answers. Choose the few metrics that speak to that question. Pull clean data from a single source of truth so no one argues about whose numbers are right. Then format the report for the audience: an executive wants a trend and a takeaway, while an HR manager may want the underlying detail.
Most HR reports fail for one of three reasons. Stale data makes the report untrustworthy, so decisions stall. Metric overload buries the one number that matters under twenty that don’t. And presenting outputs without context leaves the reader with figures but no meaning. Avoid all three by refreshing from live data, showing only the metrics tied to the question, and always pairing a number with what it means and what to do about it.
How HR Software Automates Reporting
Modern HR and payroll platforms generate the reports in this article automatically, replacing manual spreadsheet work with scheduled, real-time dashboards. Instead of exporting data and rebuilding the same report every month, HR pulls a current view on demand, and the hours once spent assembling numbers go toward interpreting them.
When you evaluate HR reporting software, look for pre-built templates for the common reports, a custom report builder for the questions unique to your business, role-based access so people see only what they should, and direct integration with payroll and time-tracking so the data is complete and current. Paycor’s HR analytics tools bring these together, turning workforce data into reports your leaders will use. Take a tour and see how Paycor helps your team spend less time building reports and more time acting on them.