


In 2020, the Department of Labor (DOL) released stats on total violations and penalties that would make your head spin. With record numbers being recorded, many HR and finance leaders wondered if their organization was at risk for penalties and violations.
Here are the labor law stats you need to know:
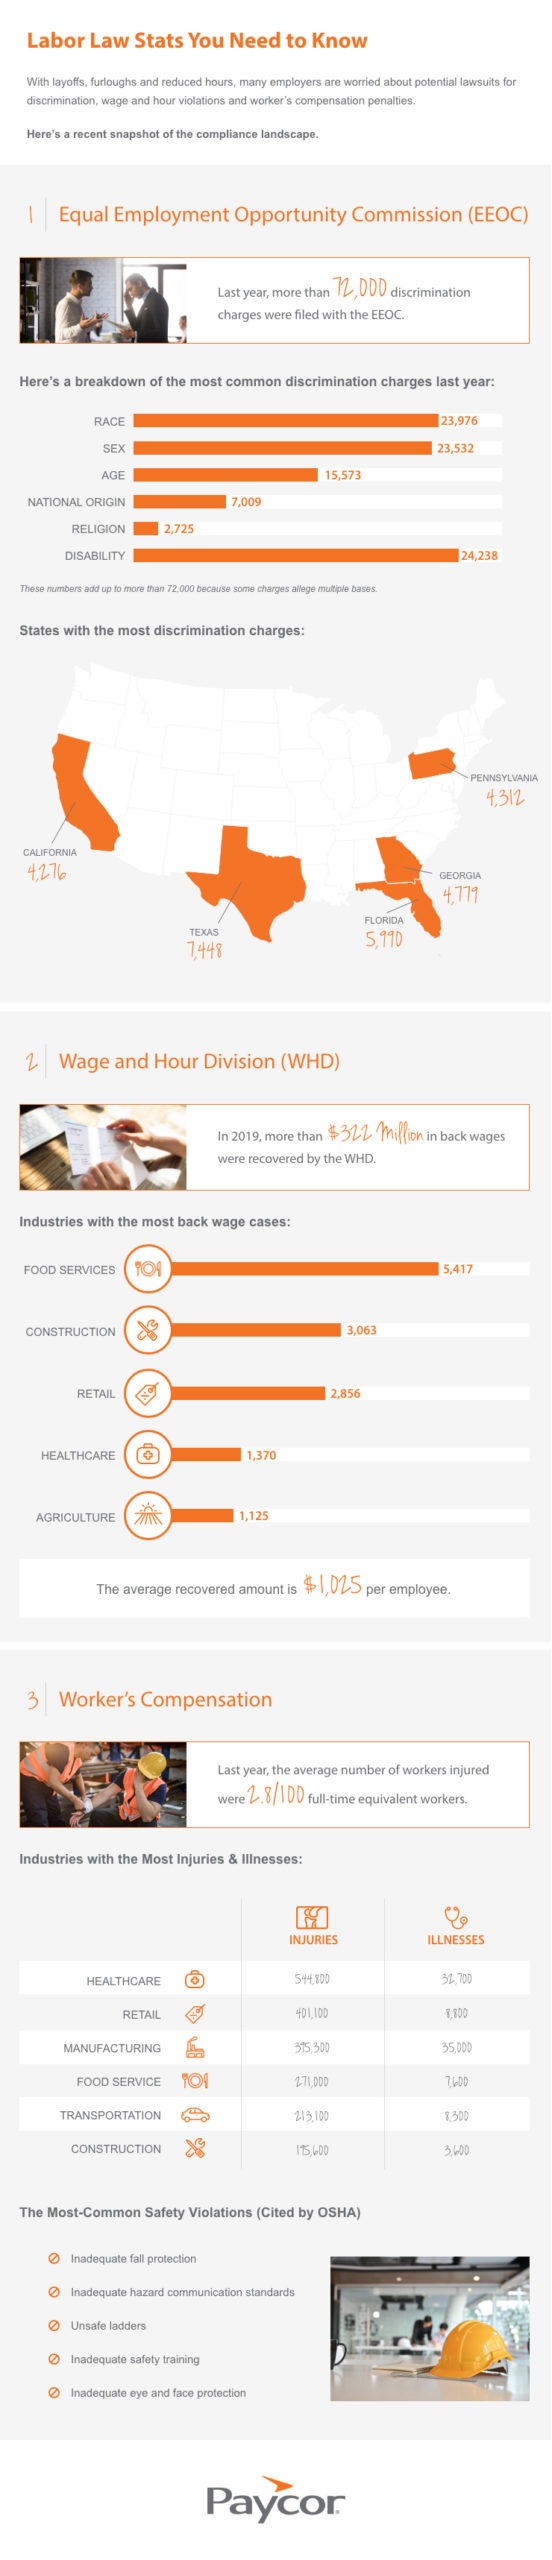
Equal Employment Opportunity Commission (EEOC)
Last year, more than 72,000 discrimination charges were filed with the EEOC.
Here’s a breakdown of the most common discrimination charges last year:
| Race | Sex | Age | National Origian | Religion | Disability |
| 23,976 | 23,532
|
15,573 | 7,009 | 2,725 | 24,238 |
These numbers add up to more than 72,000 because some charges allege multiple bases.
States with the most EEOC discrimination charges:
- Texas – 7,448
- Florida – 5,990
- Georgia – 4,779
- Pennsylvania – 4,312
- California – 4,276
Wage and Hour Division (WHD)
In 2019, more than $322 Million in back wages were recovered by the WHD.
Industries with the most back wage cases:
- Food Services – 5,417
- Construction – 3,063
- Retail – 2,856
- Healthcare – 1,370
- Agriculture – 1,125
The average recovered amount is $1,025 per employee.
Worker’s Compensation
Last year, the average number of workers injured were 2.8/100 full-time equivalent workers.
Industries with the Most Injuries & Illnesses:
- Healthcare (Injuries: 544,800; Illnesses: 32,700)
- Retail (Injuries: 401,100; Illnesses: 8,800)
- Manufacturing (Injuries: 395,300; Illnesses: 35,000)
- Food Services (Injuries: 271,000; Illnesses: 7,600)
- Transportation (Injuries: 213,100; Illnesses: 8,300)
- Construction (Injuries: 195,600; Illnesses: 3,600)
The Most-Common Safety Violations (Cited by OSHA)
- Inadequate fall protection
- Inadequate hazard communication standards
- Unsafe ladders
- Inadequate safety training
- Inadequate eye and face protection
Previous:
Social Distancing at Work